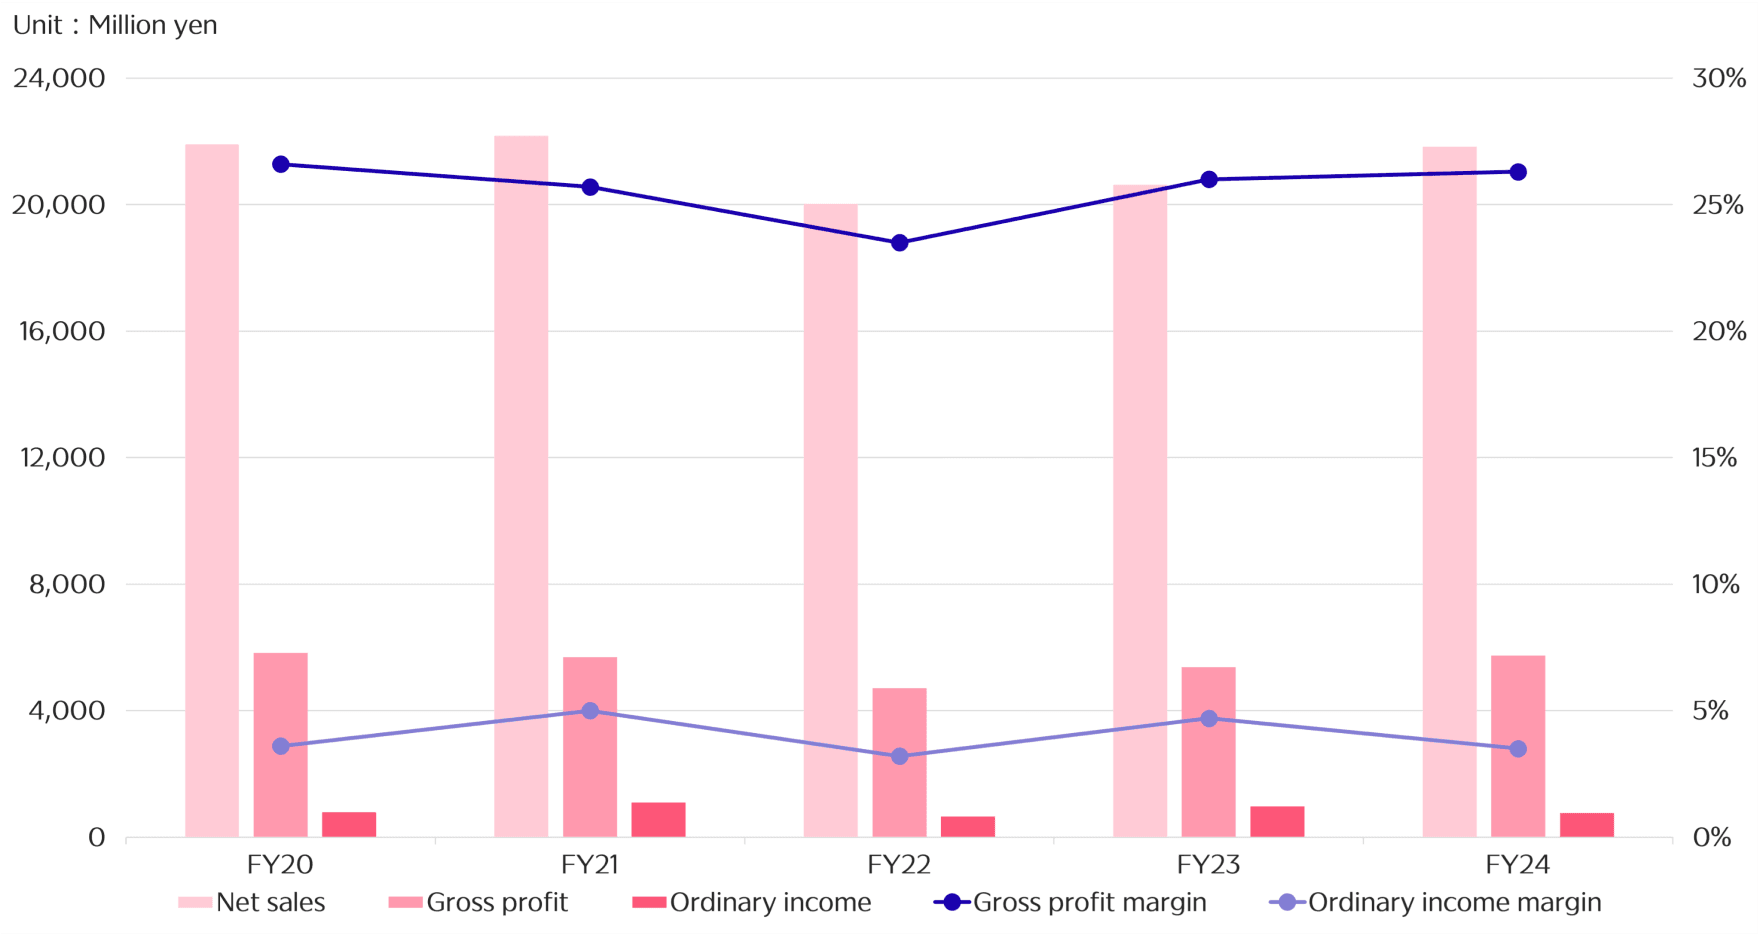
Profit and loss transition(Consolidated)
| Fiscal Year End |
FY2021 |
FY2022 |
FY2023 |
FY2024 |
FY2025 |
| Net sales(million yen) |
22,168 |
20,019 |
20,622 |
21,826 |
31,412 |
| Gross profit(million yen) |
5,689 |
4,708 |
5,367 |
5,735 |
11,230 |
| Ordinary income |
25.7% |
23.5% |
26.0% |
26.3% |
35.8% |
| Gross profit margin(million yen) |
1.099 |
649 |
965 |
764 |
4,060 |
| Ordinary income margin |
5.0% |
3.2% |
4.7% |
3.5% |
12.9% |
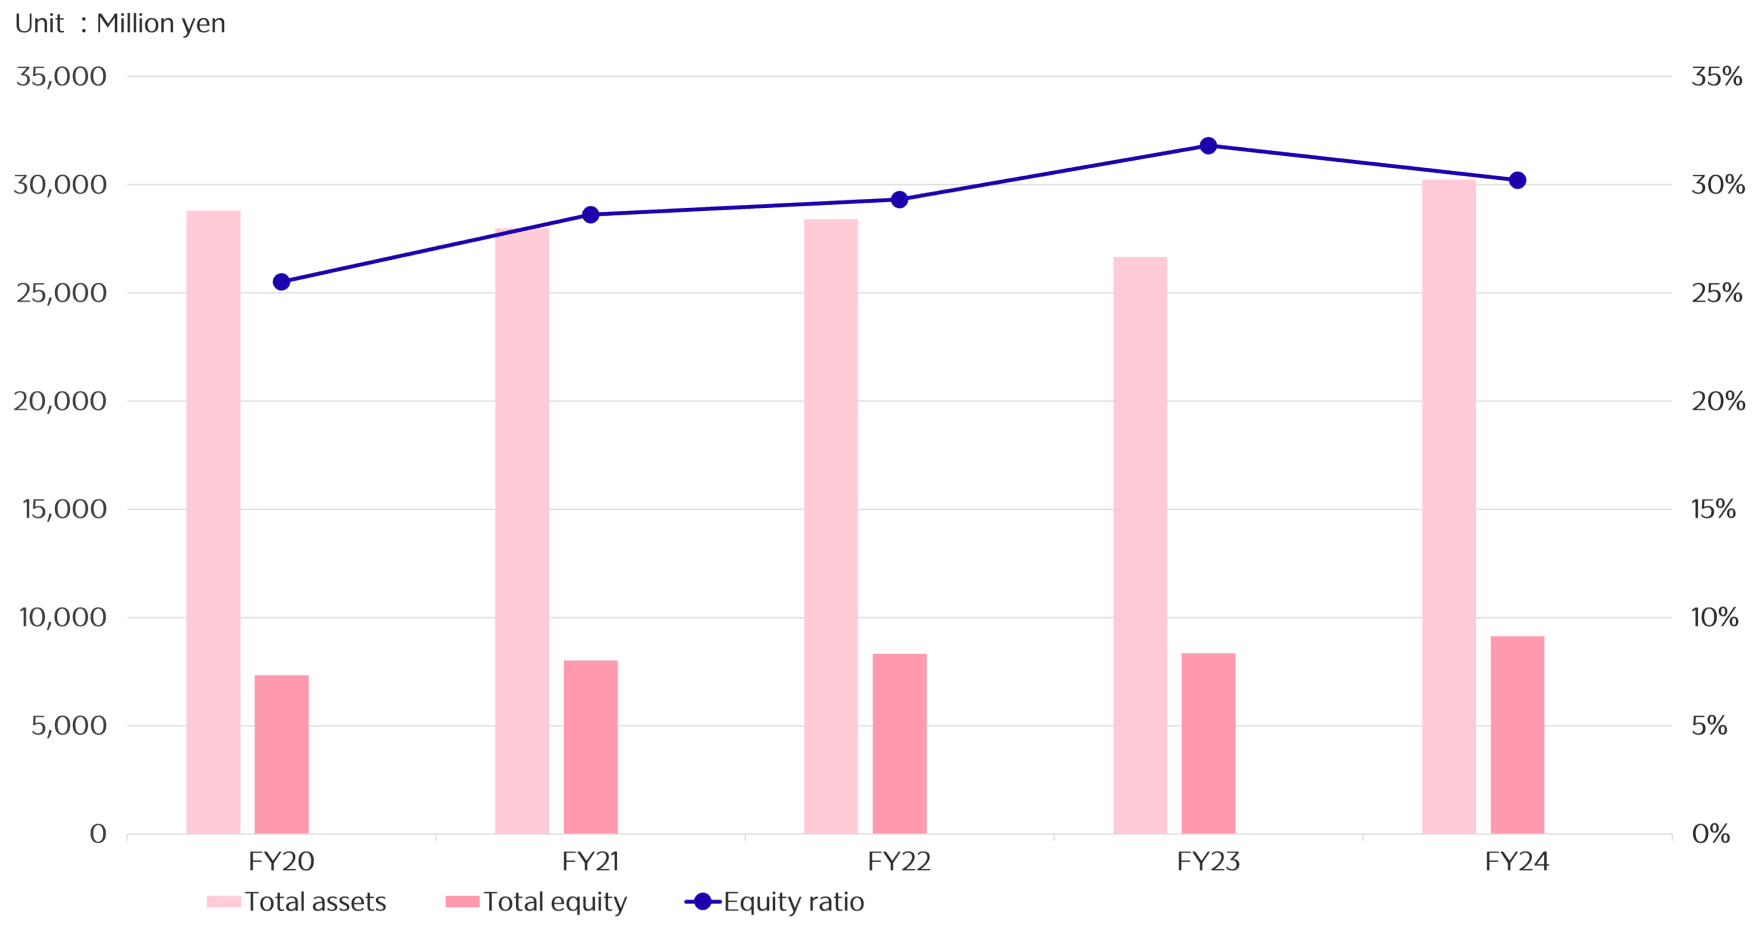
Transition of assets (Consolidated)
| Fiscal Year End |
FY2021 |
FY2022 |
FY2023 |
FY2024 |
FY2025 |
| Total assets(million yen) |
27,975 |
28,396 |
26,656 |
30,224 |
81,419 |
| Total equity(million yen) |
8,004 |
8,317 |
8,348 |
9,135 |
30,055 |
| Equity ratio |
28.6% |
29.3% |
31.8% |
30.2% |
36.9% |


